February 7, 2023 – Optical communication fibers could provide an earlier warning of devastating earthquakes of up to 30 seconds, according to a new study by an international team of researchers led by Dr. Itzhak Lior from the Institute of Earth Sciences at the Hebrew University of Jerusalem.
According to the study, published in Nature’s Scientific Reports journal, earthquake early warning (EEW) systems provide seconds to tens of seconds of warning time before potentially damaging ground motions are felt. Seismic sensors should be installed as close as possible to expected earthquake sources for optimal warning times. However, most seismological stations are located on land, while the most hazardous earthquakes occur underwater.

“Earthquakes that occur under the seabed or in areas without sensors can result in delayed detection by existing technologies, which hinders preparation,” says Dr. Lior. “Recently, an innovative method for monitoring earthquakes using optical fibers, including those deployed worldwide for Internet communication, has been gaining momentum. In this study, we showed that optical fibers can be used instead of the traditional sensors to provide early warning, especially for earthquakes that occur at sea.”
The researchers analyzed earthquakes recorded by several optical fibers deployed on the seabed off the coasts of Greece, France, and Chile. Dr. Lior’s research team was able to determine the intensity of the earthquakes and their damage potential before they were felt on land. Using this technology, earthquakes on the seabed could be detected up to 30 seconds earlier than standard methods, which could save countless lives. These findings demonstrate that using existing fiber infrastructure can simplify and speed up the establishment and operation of earthquake warning systems, as well as improve warning times.
Dr. Lior continues, “Optic fibers, including fibers from commercial telecommunications companies, can quickly determine the intensity of earthquakes and the damage potential, adding critical seconds of warning for destructive earthquakes. Using communication fibers from commercial companies is a very significant advantage for areas that are at risk of earthquakes such as Chile, Japan, the west coast of North America, and also Israel.”
View a presentation below from Dr. Itzhak Lior on Distributed Acoustic Sensing at the Ocean Bottom.
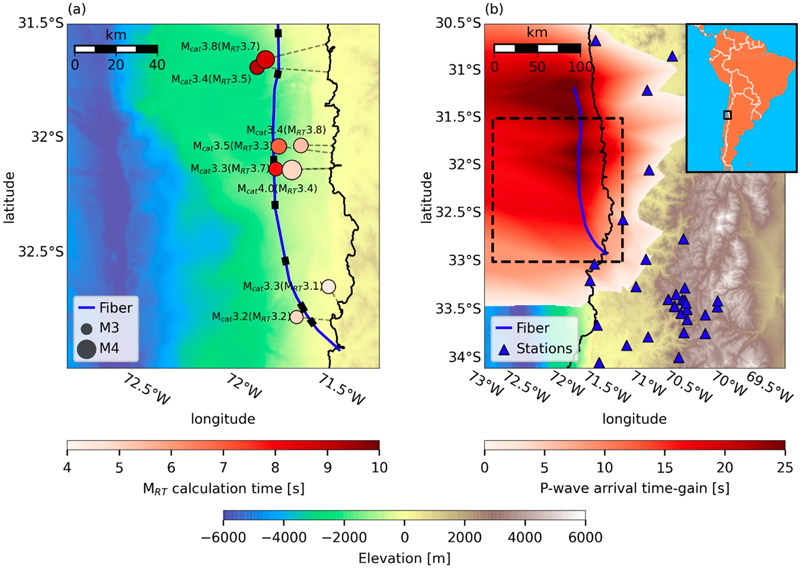
Below is one of the main figures from the study.